
Why Benchmarking Matters for Rentals
June 26, 2026 · 9 min read
Why Benchmarking Matters for Rentals
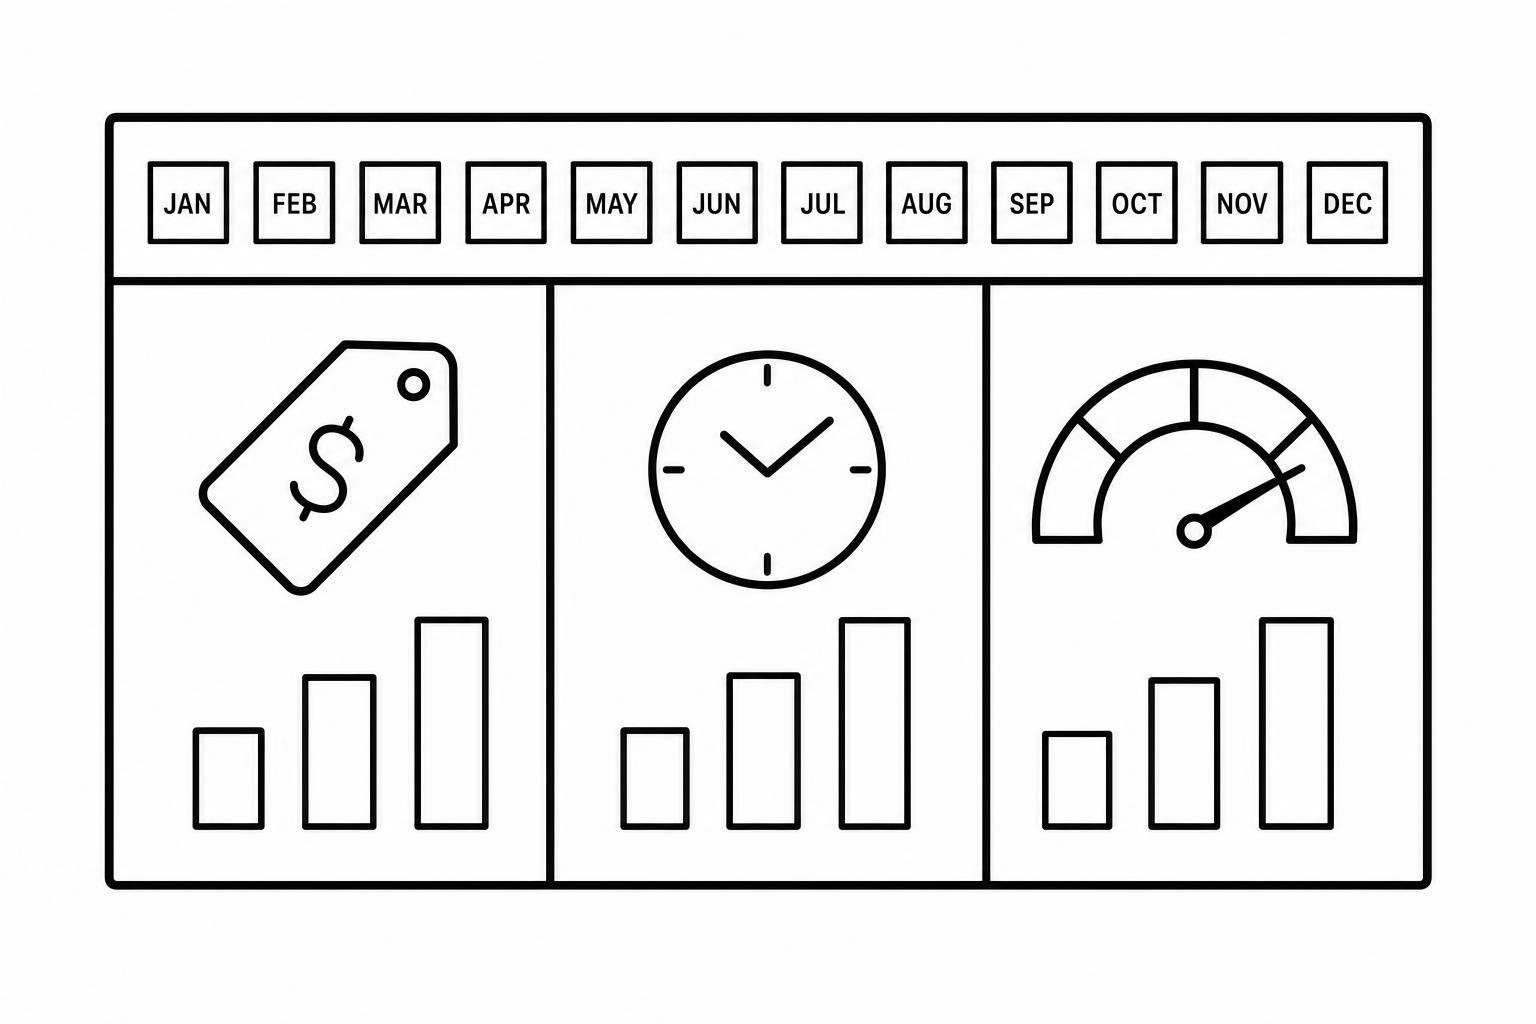
If you don’t benchmark your rental business, growth can hide problems instead of fixing them. I’d track the same KPIs at every location, review them monthly, and use them to spot weak pricing, slow turn times, low fleet use, and customer drop-off before they cut into profit.
Here’s the short version:
- Benchmarking gives me a baseline. I can compare each location against past results, targets, and market norms.
- Standard definitions matter. If one site calculates “available days” or “on-rent” differently, the numbers stop being useful.
- The main KPIs are simple: time utilization, dollar utilization, revenue per available unit, average rental rate, margin per booking, downtime, damage rate, and customer feedback and satisfaction.
- Small delays cost money. Cutting ready-to-rent time from 48 hours to 24 hours can put more inventory back into service without buying more units.
- Pricing gaps add up fast. Missing rate by just 5% on a $2,000,000 rental business can mean $100,000 in lost yearly revenue.
- Fleet balance matters too. Time utilization around 65%–75% is a solid range. Above 85% can mean the fleet is too tight. Below 55% can mean too much idle equipment.
- Add-on revenue is worth tracking on its own. Fees like delivery, damage waivers, and fuel charges often make up 10%–15% of revenue.
- Monthly review keeps problems visible. That’s how I spot which sites need pricing changes, process fixes, or fleet moves.
The point is simple: _benchmarking turns scattered numbers into decisions_. When I measure each site the same way, I can see what’s working, fix what isn’t, and grow without losing control.
The problems benchmarking helps solve
Low visibility across locations and inventory
When a rental business runs more than one site, scattered systems make apples-to-apples comparison tough. Managers often have to jump between tools just to piece together a full picture.[2]
That problem shows up fast with returned equipment. A unit can be off-rent, still waiting for inspection, and not yet ready to go back out. On paper, it exists. In practice, it’s dead stock for the moment. Benchmarking the time between "off-rent" and "ready-to-rent" turns that hidden lag into a number you can track.
A simple shift here can have a big effect. Cutting that window from 48 hours to 24 hours can increase available inventory without buying a single new unit.[2]
The same visibility gap also affects pricing and fleet use, highlighting the need to automate rental business operations to maintain consistency.
Inconsistent pricing, utilization, and downtime
Benchmarking revenue per available unit across locations helps spot pricing that’s out of line. A high average rental rate paired with low occupancy usually points to overpricing. A low average rental rate with average occupancy can mean a location is priced too low for the quality it offers.[4]
Downtime often stretches for reasons that have little to do with the repair itself. Delays in inspections, scheduling, or handoffs can keep assets unavailable longer than the actual work takes.[1] And when utilization stays too close to 100%, that’s usually a sign the fleet is too tight, which leaves less room for maintenance.
Operational issues don’t stop there. They show up in the customer journey too.
Uneven customer experience in self-service rentals
In self-service rentals, small failures can quietly kill conversions at one location while another runs fine. A failed lock code, a stalled identity check, or a missed confirmation can all create hidden drop-off points. If you don’t measure those steps the same way across sites, it’s easy to miss the pattern.
Lockii can capture booking logs, item logs, end-of-rental photos, and communication records in one trail. That makes cross-location comparison much easier.
These issues all lead back to the same need: a small set of KPIs that every location tracks the same way.
The core KPIs to benchmark in a rental business
Utilization, occupancy, and revenue per available unit
When you benchmark a rental business, two utilization metrics do most of the heavy lifting: time utilization and dollar utilization. They answer different questions, so you need both.
Think of occupancy as the snapshot view: units out ÷ units available. It tells you what’s happening right now. But a busy fleet doesn’t always mean a healthy fleet. That’s why it also helps to track revenue per available unit (RevPAR/RevPAU). This shows whether your total capacity is bringing in enough revenue, not just whether equipment is out on rent [7][5].
One thing matters here more than people think: consistency. If each location calculates these numbers a different way, your benchmark falls apart.
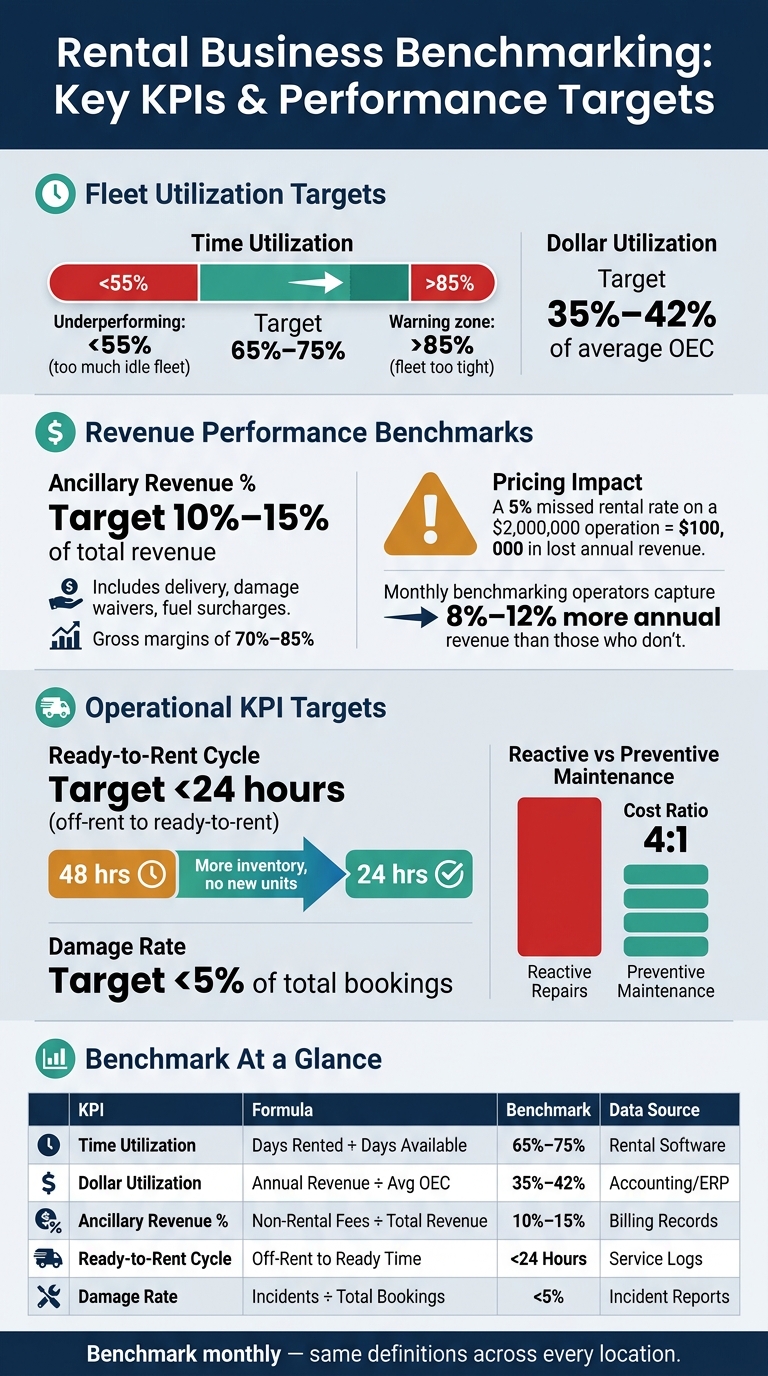
Time utilization = days rented ÷ days available. A solid target is 65%–75%. If you’re above 85%, you may be running short on capacity. If you’re below 55%, you may be carrying too much fleet [2].
Dollar utilization = annualized rental revenue ÷ average OEC. For most equipment categories, 35%–42% is a strong mark [6].
These metrics let you scale rental businesses by comparing locations, asset classes, and date ranges on the same footing.
Average rental rate, margin per booking, and operating costs
Utilization tells you volume. Margin tells you whether that volume is paying off.
Your average rental rate gives you the starting point, but on its own, it doesn’t say much. You only get the full picture when you line it up against your costs.
It also pays to break out ancillary revenue instead of lumping it into rental income. Delivery fees, damage waivers, fuel surcharges, and other add-ons usually make up 10%–15% of total revenue and often carry gross margins of 70%–85% [6]. If your ancillary share is far below 10%, you’re likely leaving money on the table.
Maintenance is another spot where margin can slip fast. Reactive repairs cost about 4× more than preventive maintenance [2]. In plain terms, if service gets pushed back, the damage often shows up in per-booking economics well before it hits the annual P&L.
Downtime, damage rate, and customer service metrics
This is where booking-day revenue can start leaking out.
Downtime and damage are often the messiest KPIs to track, mostly because teams don’t log them the same way. But they hit two things that matter right away: available inventory and customer trust.
In self-service rentals, this gets even more important. Staff aren’t standing there to spot every issue, so you need clean, standard logs. Use booking logs, item logs, and hire-end photos to track downtime, damage, and service issues the same way across every site.
Use the table below as a baseline:
| KPI | Definition | Data Source | Benchmark | | --- | --- | --- | --- | | Time Utilization | Days rented / days available | Rental software / telematics | 65%–75% [2] | | Dollar Utilization | Annualized rental revenue / average OEC | Accounting / ERP | 35%–42% [6] | | Revenue Per Available Unit (RevPAR/RevPAU) | Total revenue / total available units | Financial records | Track by location, asset class, and period [7][5] | | Ancillary Revenue % | Non-rental fees / total rental revenue | Billing records | 10%–15% [6] | | Ready-to-Rent Cycle | Time from "Off-Rent" to "Ready-to-Rent" | Service logs | < 24 hours [2] | | Damage Rate | Incidents / total bookings | Incident reports | < 5% [2] | | Net Promoter Score | Customer likelihood to recommend | Post-rental surveys | Compare by location |
How benchmarking supports growth and scalability
Better asset allocation and pricing decisions
Benchmarks matter when they shape day-to-day fleet moves and pricing. With clean KPI data, you can see where equipment should be and what it should earn.
Monthly utilization reports help you spot idle equipment at one location while another branch has stronger demand. In many cases, the answer isn’t buying more fleet. It’s moving the fleet you already have. Operators who benchmark monthly capture 8% to 12% more annual revenue than those who don’t [4].
Pricing works the same way. Benchmark gaps can show where rates need to change based on market, demand, and asset condition. A 5% missed rental rate on a $2 million operation leads to $100,000 in lost annual revenue [8].
More consistent operations across locations
These same benchmarks also show which site practices are worth rolling out across the business. If one location is beating the rest, benchmarking helps you pinpoint the process behind it.
At Taylor Rental, operator Caparco put standardized procedures and pricing discipline in place across the business, doubling profitability within the first year [8]. In self-service rentals, standardized self-service workflows across locations help customers get the same experience at every site.
Lower-risk expansion with centralized data
Opening a new location is always a bet. Benchmarking gives you a better way to place it.
When you have clean data on utilization, revenue per available unit, and occupancy costs across current sites, you can set targets based on your best locations instead of guessing. That changes the lease conversation in a big way.
Centralized data is what makes those comparisons repeatable across every location. Lockii centralizes multi-location booking, maintenance, audit logs, and GPS tracking across locations, giving operators one data layer for benchmarking.
How to put benchmarking into practice
Once you’ve picked the right KPIs, the next move is simple: make sure every location reports them in the same way.
Set goals and standardize KPI definitions
Start by getting clear on what you want to improve. Maybe the main focus is estimating profitability. Maybe it’s getting ready to expand. Maybe it’s day-to-day efficiency. That goal decides which KPIs deserve the most attention right now.
Then standardize how each KPI is defined across every location before you compare results. This part matters more than it sounds. If one location treats all 365 days as "available" while another counts only business days, your time utilization numbers stop meaning the same thing. The same problem shows up with rental rate by period and maintenance-to-revenue ratios. Standardized definitions are what make cross-location benchmarks trustworthy [3].
Once those definitions are locked in, you need one source of truth.
Centralize data and review performance monthly
Clean data is where this either works or falls apart. Booking data, maintenance logs, damage reports, and financial figures should live in one place, not scattered across spreadsheets, inboxes, and side notes. If the data sits in five places, comparisons across locations start to get shaky fast. In multi-location self-service rentals, missing logs and late updates can skew the numbers before you even pull a report. This is why having a contactless rental process in place is essential for capturing real-time data.
Review your core metrics every month, and use faster checks only when utilization changes fast and needs attention [6].
Lockii puts booking data, GPS tracking, maintenance logs, damage tracking, and audit trails from all locations into one platform. That makes it much easier to keep the data clean and comparable month after month.
After that, benchmarking stops being just a report. It becomes part of how you run the business.
Conclusion: Benchmarking turns growth into a repeatable system
Benchmarking helps make growth repeatable. When every location reports the same KPIs, you can move assets, adjust pricing, and fix downtime before it cuts into margin - and open new locations without losing sight of what’s already working.