
Revenue vs. Utilization: Key Metrics for Rentals
Track revenue and utilization together—use RevPAR, dynamic pricing, and real-time fleet data to optimize pricing, cut idle costs, and boost rental profits.
Want to boost your rental business profits? Start tracking two key metrics: revenue and utilization. These metrics work together to help you understand how effectively your assets generate income and how often they’re in use. Here’s the short version:
- Revenue: Measures total income from rentals and add-ons (like insurance or fuel charges). A good target is for ancillary income to make up 12% of total revenue.
- Utilization: Tracks how much of your inventory is actively rented out. Aim for 65–75% utilization for most assets, with higher targets (70–80%) for equipment rentals.
Focusing on just one metric can lead to problems. High utilization at low prices may not cover costs, while high revenue with idle assets racks up expenses like insurance and depreciation.
The solution? Balance both metrics using tools like RevPAR (Revenue Per Available Rental), which combines pricing and usage into one number. This approach ensures you’re maximizing profits across all locations.
For multi-location businesses, tracking these metrics in real-time with GPS tracking for multi-location rentals helps identify underperforming branches, adjust inventory, and fine-tune pricing strategies. Software like Lockii simplifies this process with centralized dashboards, automated reminders, and GPS tracking.
What is Revenue in Rental Businesses?
Definition and Formula
Revenue is the total income a rental business earns from rental payments and any additional services. To calculate net rental revenue, subtract direct expenses - like payment processing fees - from the total rental payments. Here’s the formula:
Total Rental Payments - Direct Expenses (e.g., payment processing fees).
Revenue includes both base rental fees and extra income sources, such as insurance, GPS, fuel charges, and damage waivers. A good benchmark is for ancillary income to make up at least 12% of total revenue. For instance, if your base rental fees amount to $100,000, you’d aim to generate an additional $12,000 from these add-ons.
Tracking revenue at the individual asset level helps you pinpoint the most profitable items in your inventory, often referred to as "star performers." This data is also crucial for improving ROI calculations with a contactless rental calculator. Interestingly, many rental businesses see an 80/20 split, where around 20% of their assets account for 80% of the total revenue.
Why Revenue Matters for Multi-Location Rentals
Monitoring revenue across multiple locations helps identify which branches are thriving and which may need operational changes. By analyzing revenue alongside customer geography, you can uncover high-demand areas. This insight can guide decisions about opening new locations or focusing advertising efforts in specific areas.
Key metrics like Average Daily Rate (ADR) and RevPAR (Revenue Per Available Rental) reveal your pricing strength and how much each asset contributes to your earnings. For businesses with multiple locations, these metrics are vital for "fleet sizing", ensuring that high-demand locations have enough inventory while reducing excess assets in less active areas.
In B2B equipment rental, long-term clients can bring in 10–20 times the revenue of one-time customers. This makes revenue tracking essential for identifying and nurturing these high-value relationships.
Understanding revenue is the first step toward evaluating how efficiently your assets are being utilized.
sbb-itb-eb44693
What is Utilization and Why Does it Matter?
Definition and Formula
Utilization reflects how much of your rental inventory is actively generating income. It’s essentially the ratio of active rental days to the total days the equipment is available for rent. The formula looks like this:
(Total Rental Time ÷ Total Available Time) × 100.
For example, if a trailer is available for rent for 30 days but is only rented for 21 days, the utilization rate would be 70%. Most rental businesses aim for a utilization rate between 65% and 75%, while construction equipment rental companies often shoot for a slightly higher range of 70–80%.
There are different ways to measure utilization:
- Physical Utilization: Tracks the actual days or hours an asset is rented.
- Financial Utilization (Dollar Utilization): Compares the rental revenue earned to the potential revenue if the equipment was rented at its standard, undiscounted rate.
- Operational Utilization: Uses tools like GPS and telematics to monitor how assets are being used, such as tracking engine hours.
"Utilization is the primary method by which tool rental companies measure asset performance." – Wikipedia
Understanding these metrics is key to assessing asset efficiency.
How Utilization Measures Asset Efficiency
Utilization isn’t just a performance metric - it’s a way to quantify the cost of idle assets. Every day an asset sits unused, it still racks up expenses like insurance, storage, depreciation, and financing. For heavy machinery like excavators, these costs can range from $500 to $800 per day, while smaller equipment like generators might cost $25 to $50 per day.
Low utilization often signals problems like excess inventory, mismatched offerings, or poor asset placement. On the flip side, if utilization consistently exceeds 85–90% and you’re turning away rentals, it might be time to expand your inventory. By closely monitoring utilization, you can make quick operational adjustments - like relocating assets to areas with higher demand or tweaking pricing strategies.
"Every idle day represents trapped capital. When a $150,000 excavator sits unused, you're still paying for insurance, storage, depreciation, and financing costs - typically $500 to $800 per day - without generating any revenue." – Kyle Clements, Founder & CEO, Quipli
Rental Inventory KPIs and Metrics
Revenue vs. Utilization: How These Metrics Work Together
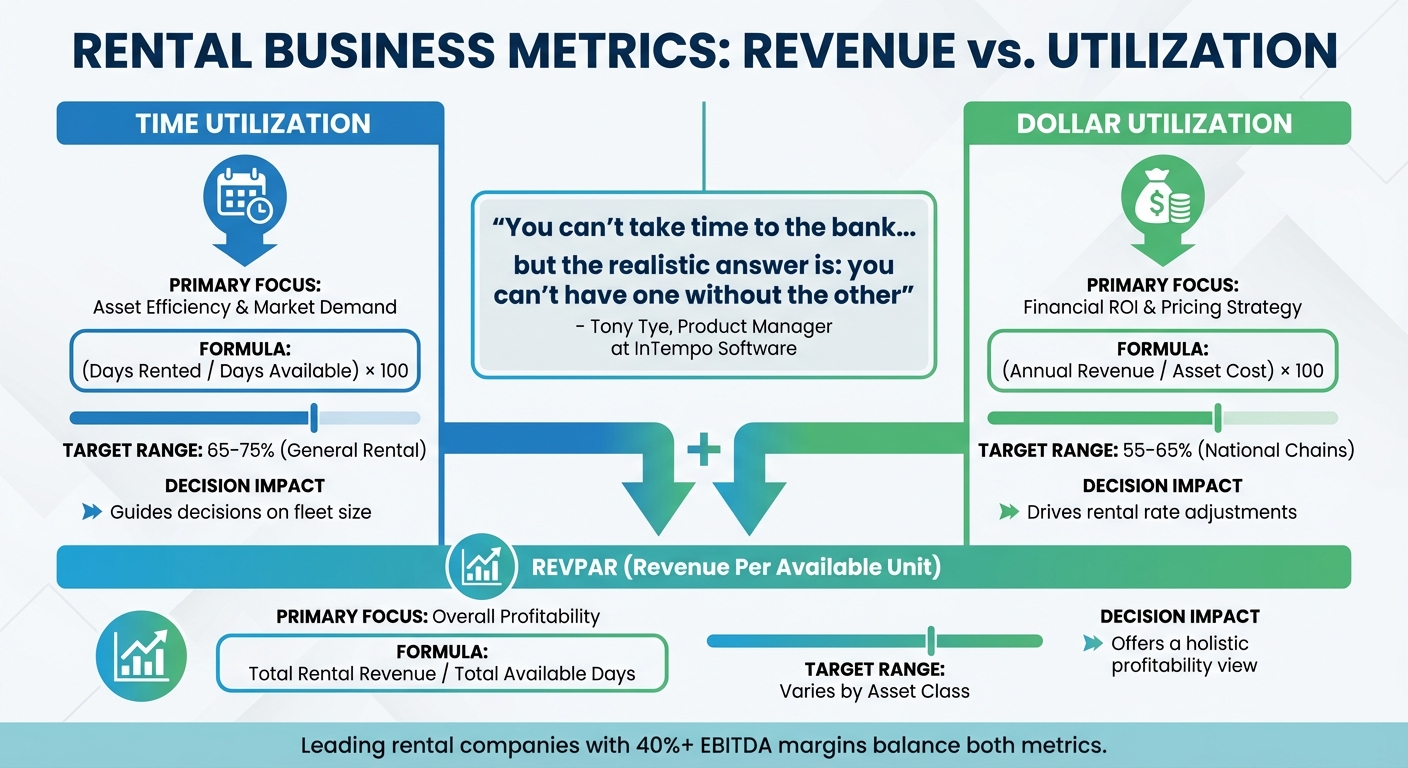
Revenue vs Utilization Metrics Comparison for Rental Businesses
Comparison Table: Revenue vs. Utilization
Revenue and utilization might focus on different aspects of your rental business, but they’re closely intertwined. The table below breaks down each metric’s purpose, calculation, and how it influences decision-making.
Time utilization measures how often your assets are rented out, giving you insights into demand and how efficiently your fleet is being used. On the other hand, dollar utilization (also called financial utilization) evaluates whether your pricing strategy is delivering returns based on the asset’s acquisition cost. Essentially, dollar utilization builds on time utilization by adding a financial perspective to the equation.
"You can't take time to the bank... but the realistic answer is: you can't have one without the other".
– Tony Tye, Product Manager at InTempo Software
| Metric | Primary Focus | Formula | Target Range | Decision Impact |
|---|---|---|---|---|
| Time Utilization | Asset efficiency and market demand | (Days Rented / Days Available) × 100 | 65%–75% (General rental) | Guides decisions on fleet size |
| Dollar Utilization | Financial ROI and pricing strategy | (Annual Revenue / Asset Cost) × 100 | 55%–65% (National chains) | Drives rental rate adjustments |
| RevPAR | Overall profitability | Total Rental Revenue / Total Available Days | Varies by asset class | Offers a holistic profitability view |
For multi-location businesses, tracking both metrics in real time is key. It allows you to compare performance across individual assets, locations, or even the entire organization. This can help you identify shifts in regional demand. Leading rental companies, those with EBITDA margins of 40% or higher, achieve success by carefully balancing utilization with availability.
By understanding these metrics, you’re better positioned to see why monitoring both is critical for driving profitability.
Why You Need to Track Both Metrics
The interplay between time and dollar utilization is where the real insights emerge. When these two metrics align, they unlock the potential for profitability across multiple locations. This is especially true when scaling rentals to new locations.
Focusing on just one metric can lead to costly blind spots. For instance, high time utilization may seem like a win, but if dollar utilization is lagging, you’re essentially overworking your fleet at rates too low to recover your investment before the asset’s useful life ends.
"Being 'busy' is not the same as being profitable".
– The Hapn Team
On the flip side, aiming for high rental rates without paying attention to time utilization can leave expensive assets idle. This inactivity racks up costs like insurance, depreciation, storage, and financing, all without generating revenue.
The best approach is to track both metrics together - or use a combined measure like RevPAR (Revenue Per Available Rental). RevPAR incorporates both pricing and occupancy, offering a clearer picture of an asset's earning potential. For example, if time utilization is high but dollar utilization is low, it might indicate that your rates are too low or maintenance costs are eating into your profits. Conversely, low levels in both metrics could signal that you have excess inventory that needs to be reallocated or sold off.
How to Balance Revenue and Utilization for Maximum Profit
Balancing revenue and utilization is crucial for ensuring profitability. This section dives into why finding the right equilibrium between these two metrics is so important.
Problems with Focusing on Just One Metric
Zeroing in on just one metric - whether it's utilization or revenue - can lead to costly inefficiencies. For instance, pushing utilization too high with low rental rates might cover operating costs, but it won't account for wear and tear, asset replacement, or rising maintenance expenses. On the flip side, setting high rental rates may boost revenue per transaction, but if equipment sits idle, you're still losing money on insurance, depreciation, financing, and storage costs.
Take this into perspective: many equipment hire companies face challenges with low utilization, but industry leaders aim for rates around 70%. Why? Because being busy doesn’t automatically mean being profitable. Renting out equipment 90% of the time at bargain rates might generate less income than renting it at 70% utilization with competitive pricing. This is where a combined metric like RevPAR (Revenue Per Available Rental) becomes invaluable, as it integrates both utilization and pricing into one cohesive measure.
Using RevPAR to Combine Both Metrics
RevPAR simplifies the balancing act by combining Average Daily Rate (ADR) and utilization rate into one clear metric. It shows how well your pricing strategy and asset deployment work together. Essentially, RevPAR highlights the true earning potential of every asset in your fleet.
Here’s how it works: imagine an ADR of $150 and a utilization rate of 60%. Your RevPAR would be $90, meaning that each available day for the asset - whether rented or not - is effectively generating $90. If your RevPAR is low despite high utilization, it’s a cue to increase rates. Conversely, if low utilization is dragging RevPAR down, strategies like promotional pricing or moving the asset to a high-demand area might help. Implementing automated rental software can also streamline these adjustments by enabling real-time availability and instant bookings.
For businesses with multiple locations, RevPAR becomes even more powerful. It allows you to compare branch performance at a glance and spot regional demand trends before they hurt your profits. Some locations might support premium pricing, while others could benefit from volume-driven strategies. RevPAR helps you tailor your approach to each market and maximize profitability across the board.
How to Calculate and Track These Metrics Across Multiple Locations
Understanding the balance between revenue and utilization is one thing, but applying it across multiple branches is where the challenge lies. Calculating and tracking these metrics consistently across locations requires a structured approach and the right tools. This is critical for ensuring your fleet operates profitably across the board.
Example Calculations for Revenue and Utilization
To evaluate performance across branches, start with the basics:
- Physical Utilization: This measures how often an asset is rented. Divide the number of days an asset was rented by the total number of days it was available. For example, if a trailer was rented 21 out of 30 days, its utilization rate is 70%. Even small changes in this rate can have a big impact on overall performance.
- Financial Utilization: This focuses on revenue efficiency. Divide the actual rental revenue by the potential revenue if the asset had been rented at the full, non-discounted rate. Say a piece of equipment could have generated $3,000 at full price but only brought in $1,800 due to discounts or idle time. Its financial utilization would be 60% ($1,800 ÷ $3,000).
When managing multiple locations, these calculations need to scale. For instance, imagine you oversee three branches with a fleet of 200 pieces of equipment worth $10 million. If Branch A achieves 65% utilization, Branch B lags at 50%, and Branch C hits 75%, the 15% gap between Branch B and your target (65%) could represent an annual carrying cost of $821,850 for idle equipment. Tracking utilization by location helps identify underperforming branches and their impact on overall profitability.
To make this work, link booking data with inventory and branch records. This allows you to tie each asset to a specific location, enabling side-by-side comparisons. For example, one branch might thrive due to higher local demand, while another might suffer from inventory mismanagement or hoarding, leading to shortages elsewhere.
Using Software for Real-Time Tracking
Relying on spreadsheets for multi-location operations is a recipe for inconsistent data and inefficiency. Modern software platforms like Lockii simplify this process by offering real-time tracking and automation. These tools provide the visibility needed to manage assets effectively across branches.
Lockii, for example, offers dashboards and automated reports that track key metrics like on-time return rates, extension counts, and utilization percentages. GPS tracking pinpoints asset locations, highlights high-revenue areas, and helps determine whether to open new drop-off points or reallocate inventory. Its features, such as Item Audit Logs and Booking Audit Logs, ensure every asset has a clear paper trail, eliminating "ghost assets" - equipment mistakenly listed as available.
Designed for multi-location operations, Lockii automatically segments data by branch, making cross-location benchmarking seamless. For instance, you might discover that a downtown branch achieves 80% utilization on bike rentals, while a suburban branch lags at 45%. This insight could prompt a transfer of inventory to meet demand.
Lockii also monitors the "Ready-to-Rent" cycle, the time it takes for an item to be cleaned, inspected, and ready for the next rental. Reducing this cycle from 48 hours to 24 hours can significantly improve utilization without adding more equipment.
Another common issue is sales reps at different branches not knowing what's truly available. Lockii's centralized system eliminates this problem by providing instant fleet visibility across all locations. This reduces double-bookings and ensures customers can confidently reserve equipment from any branch, improving both efficiency and customer satisfaction.
Ways to Improve Revenue and Utilization
Balancing revenue growth and asset utilization can be tricky, but the strategies below tackle both goals simultaneously. Start by refining your pricing approach to adapt to demand shifts and maximize profitability across your fleet.
Adjust Pricing Based on Demand
Using dynamic pricing can keep your equipment in use while squeezing the most out of every rental. Rather than sticking with fixed rates, adjust prices based on demand trends and usage patterns. For instance, if your equipment tends to sit idle during weekdays, dropping rates by 30–40% can attract contractors during slower periods. On the flip side, raising prices for weekends or holidays can help capture higher earnings when demand peaks.
Incentives tied to rental duration can also boost stability. For example, offering a weekly rate of $2,400 instead of a $600 daily rate encourages longer bookings. If equipment has been unused for more than a week, offering last-minute discounts of 10–15% can prompt immediate rentals, helping you avoid carrying costs.
"You can't take time to the bank... I encourage companies to focus on maximizing their dollar utilization – not their time utilization". – Tony Tye, Product Manager at InTempo Software
Analyze Demand by Location
After fine-tuning pricing, the next step is to evaluate where demand is strongest. By mapping customer ZIP codes and addresses against revenue data, you can pinpoint high-demand clusters. For example, if a significant portion of bookings comes from specific neighborhoods, you might allocate more inventory to those branches or even open a new drop-off location nearby.
GPS tracking provides even deeper insights. Monitoring where equipment is actually being used - not just where it’s picked up - can reveal untapped markets. For instance, if trailers rented from a suburban branch are frequently driven to a downtown construction zone, setting up a kiosk or unmanned pickup point closer to that area could save customers time and increase bookings.
Weekly transfer planning can also help. Moving equipment from low-utilization branches to high-demand locations ensures your fleet is being used efficiently. A centralized system offering real-time fleet visibility across all locations can prevent double-bookings and missed opportunities by giving sales teams an accurate view of availability.
Use Automation to Scale Operations
When paired with smart pricing and demand analysis, automation can streamline processes and keep assets generating revenue. Tools like Lockii’s automated reminders help improve on-time returns, making sure equipment is ready for the next customer without delays. Online rental extensions allow customers to add time to their bookings without manual intervention, increasing overall rental hours per asset.
Self-service options further reduce operational bottlenecks. Lockii’s 24/7 pickup system, which uses digital locks, enables customers to collect equipment outside regular business hours - capturing demand that might otherwise go unmet. Automated checklists for inspections and maintenance speed up the turnaround process, ensuring equipment is ready to rent again quickly .
Real-time dashboards tracking metrics like extension rates, on-time returns, and utilization percentages provide actionable insights. They help identify underperforming assets or branches, allowing for quick fixes. Maintenance tracking tools can flag equipment with recurring issues, so you can retire problematic assets before they hurt profitability. By cutting out manual data entry and spreadsheet updates, automation lets your team focus on strategic improvements instead of administrative tasks.
| Strategy | Impact on Utilization | Impact on Revenue |
|---|---|---|
| Dynamic Pricing | Boosts usage during slow periods | Optimizes earnings during high-demand times |
| Automated Reminders | Enhances turnaround and return rates | Increases rental extensions and minimizes downtime |
| Fleet Rebalancing | Reduces idle equipment at low-demand branches | Captures revenue from high-demand locations |
| Preventative Maintenance | Cuts downtime for repairs | Keeps assets available for profitable rentals |
Conclusion
Keeping an eye on both revenue and utilization gives you a well-rounded perspective on your rental business. Time utilization shows how actively your assets are being used, while dollar utilization dives into how profitable those rentals actually are. Focusing on just one of these metrics can lead to a skewed view of your asset performance.
"You can't have one without the other. If you understand what both data points are telling you, these two indicators can become an anchor point in managing your fleet and financial position." – Tony Tye, Product Manager, InTempo Software
Many rental businesses aim for around 65% time utilization and 55–65% dollar utilization. RevPAR (Revenue Per Available Rental) blends these metrics into one, making it easier to compare performance across multiple locations.
For businesses operating in several locations, real-time data access is a game changer. Relying on spreadsheets for tracking can leave you with blind spots, leading to idle assets. Lockii’s centralized dashboard solves this by offering live updates on utilization, revenue, and asset health across all your locations. Built for contactless, multi-location operations, it also includes automated reminders and self-service rental extensions, helping you capture extra rental hours and ensure timely returns - all without needing staff intervention.
FAQs
What’s the fastest way to find my “star performer” rentals?
To spot your top-performing rentals, dive into your booking and usage data. Look for assets that generate the most revenue and maintain strong usage rates. Pay attention to two key metrics: time utilization (how frequently an asset is rented out) and financial utilization (revenue compared to its acquisition cost). Tools like Lockii make this easier by turning raw data into actionable insights, enabling you to identify rentals that are both consistently booked and high-earning, so you can prioritize them strategically.
How do I set RevPAR targets for different asset types and locations?
When setting RevPAR targets, it’s important to evaluate several key factors: market demand, asset performance, and industry benchmarks. Start by diving into historical data for each property type and location. This helps you understand past trends and set a solid foundation for your goals.
Next, use competitive benchmarks to gauge what’s realistic. But don’t stop there - remember to factor in seasonal trends, the condition of your assets, and location-specific considerations. These variables can significantly influence your targets.
If this sounds like a lot to juggle, platforms like Lockii make it easier. Their tools combine analytics and automation to help you monitor, adjust, and fine-tune RevPAR goals across multiple properties. It’s a smarter way to stay on top of your revenue strategy.
When should I raise prices vs. move inventory to another branch?
When demand is strong, your assets are consistently rented, and higher rates won't scare off customers, it's a great time to increase prices. This approach boosts your revenue per rental without sacrificing occupancy. On the flip side, if some assets are sitting idle or demand is low in a particular location, consider transferring them to another branch where they’re more likely to be used. Reallocating underutilized inventory can enhance both efficiency and profitability. By carefully combining these strategies, you can make the most of your revenue and ensure your assets are working effectively across all locations.