
Top Tools for Market Analysis in Rental Expansion
January 24, 2026 · 23 min read
Top Tools for Market Analysis in Rental Expansion
Expanding a rental business requires data-driven decisions to avoid costly mistakes and maximize profits. Tools like AirDNA, Key Data Dashboard, and Rentana provide detailed insights into market trends, pricing strategies, and property performance. These platforms help identify high-growth neighborhoods, predict rental income, and optimize pricing based on real-time data. Whether you're managing vacation rentals, multifamily properties, or commercial spaces, these tools simplify market research and revenue optimization.
Key Takeaways:
- AirDNA: Best for vacation rental insights with global coverage and precise revenue projections.
- Key Data Dashboard: Offers direct-source booking data and geo-targeted heat maps for vacation rentals.
- Wheelhouse: Focuses on dynamic pricing and real-time booking trends.
- PriceLabs: Specialized in automated pricing and localized market trends.
- Mashvisor: Ideal for U.S. real estate investors with ROI heatmaps and rental strategy comparisons.
- Rentana: AI-powered revenue insights for multifamily portfolios.
- Zillow: Provides rental and property data for U.S. markets with tools like Market Heat Index.
- CoStar: Tailored for commercial real estate with detailed market analytics.
- Lockii: Simplifies rental operations with contactless management tools.
- Rentometer: Delivers hyperlocal rent comparisons and historical data and a rental pricing calculator for pricing strategies.
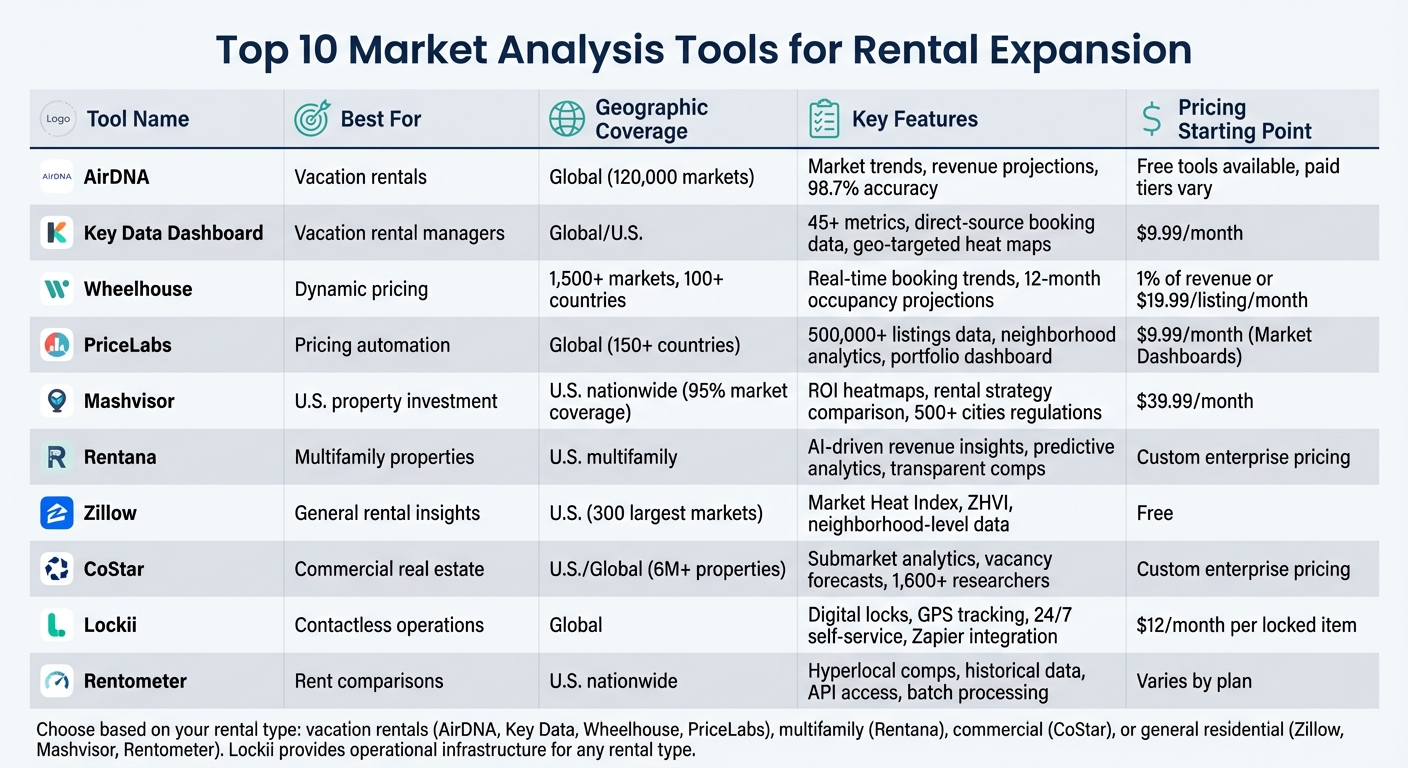
Quick Comparison:
| Tool | Best For | Coverage | Key Features |
|---|---|---|---|
| AirDNA | Vacation rentals | Global | Market trends, revenue projections |
| Key Data | Vacation rental managers | Global/U.S. | Heat maps, direct booking data |
| Wheelhouse | Dynamic pricing | U.S./100+ countries | Real-time booking trends |
| PriceLabs | Pricing automation | Global | Localized trends, portfolio analytics |
| Mashvisor | U.S. property investment | U.S. | ROI heatmaps, rental strategy |
| Rentana | Multifamily properties | U.S. | AI-driven revenue insights |
| Zillow | General rental insights | U.S. | Market Heat Index, rental data |
| CoStar | Commercial real estate | U.S./Global | Submarket analytics, detailed forecasts |
| Lockii | Contactless operations | Global | Digital locks, GPS tracking |
| Rentometer | Rent comparisons | U.S. | Local comps, API integration |
These tools cater to various needs, from short-term vacation rentals to large-scale multifamily portfolios. Choosing the right one depends on your business goals and target market.
1. AirDNA
Market Trends and Insights
AirDNA monitors data from over 10 million vacation rentals across 120,000 markets worldwide[13][14]. Its _Market Score_ evaluates key factors like occupancy rates, revenue potential, and seasonal trends, making it easier to compare cities[10]. On top of that, AirDNA's _Submarket Insights_ feature allows rental operators to dig deeper into specific neighborhoods or zip codes to find areas with strong growth potential[10][14].
The platform boasts an impressive 98.7% accuracy rate for its performance estimates[14]. Andrea Abela, Portfolio Officer at zzZing Rentals, shared:
"Before we started using AirDNA, our methodology was a little more trial and error... AirDNA closed our information gap"[14].
This detailed analysis lays the groundwork for crafting smarter pricing strategies.
Pricing and Revenue Optimization
AirDNA’s _Custom Comp Sets_ tool lets users filter properties by bedroom count, type, and amenities to identify those with the highest earning potential[10][14]. Its pacing data adds another layer by showing real-time booking activity, helping users adjust pricing based on future demand rather than just historical trends[5]. Max Schuster, Chief Revenue Officer at Staymarquis, pointed out:
"Investment properties that take our recommendations receive two times the annual gross booking revenue than comparable properties with similar strategies"[14].
With such robust data, AirDNA supports rental businesses in maximizing their revenue potential. This is particularly effective when scaling rental businesses with contactless models to reduce overhead.
Geographic Coverage
AirDNA’s _Market Explorer_ covers 120,000 markets globally, offering filters for revenue, ADR, stay length, and listing count. Users can also sort by environment type - whether mountain, coastal, or urban - to refine their market choices[14]. For instance, ahead of the 2026 World Cup, Los Angeles Airbnb prices are expected to rise by 56%[11]. Additionally, AirDNA’s research for 2025 and 2026 highlights promising U.S. investment locations, including Columbus, Georgia; Peoria, Illinois; Fairbanks, Alaska; and Akron, Ohio[13].
Best Use Case for Rental Expansion
Expanding into new markets requires precise evaluation, and AirDNA excels at helping rental businesses with market selection and property analysis. The platform’s _Rentalizer_ tool provides a _Confidence Score_ to gauge the reliability of revenue projections by analyzing nearby comparable properties[12]. Cindy Diffendiffer, CEO of Orion Haus, noted:
"AirDNA provides us with credibility. Instead of guessing what we think the value of the property will be over the course of the year, we can show property owners the figures and explain exactly why we have come to that conclusion"[14].
AirDNA caters to different needs with various pricing tiers, including free tools like the _Revenue Calculator_ and _Listing Optimizer_, research solutions for individual investors, and enterprise-level options with API access for property managers[10].
2. Key Data Dashboard
Market Trends and Insights
Key Data Dashboard monitors 45+ metrics, providing a thorough view of market performance [8]. Unlike platforms that rely on scraped data from online travel agency (OTA) listings, this tool pulls direct-source data from property management systems, booking platforms, and partner networks. This means the insights are based on actual confirmed bookings and revenue, giving you a clearer picture of market trends [8][9].
The platform also features geo-targeted heat maps, which highlight guest activity patterns across various regions. These maps make it easier to identify emerging markets before they become oversaturated [8]. With benchmarking data covering over 700,000 properties, rental operators can measure their performance against competitors in specific neighborhoods [8]. Additionally, the tool includes pacing data, which shows reservations already secured, allowing you to compare current bookings with last year’s numbers [9]. This data-driven approach helps uncover regional trends and opportunities.
Geographic Coverage
Key Data Dashboard provides global market coverage, though the level of detail depends on the number of operators participating in each region [4][15]. The platform updates its data daily, ensuring you stay ahead of market changes instead of reacting to them after the fact [9]. You can refine your analysis by filtering data based on submarkets, neighborhoods, bedroom counts, or property types, tailoring insights to your specific needs [9].
This approach ensures the data reflects actual booking trends rather than misleading indicators like blocked calendar dates, which can inflate metrics like occupancy rates and average daily rates [9]. With this precision, you can rely on accurate, actionable insights.
Best Use Case for Rental Expansion
Key Data Dashboard is particularly useful for assessing new markets before making major investments. It allows you to compare performance across destinations and property types - for instance, evaluating how four-bedroom properties perform compared to two-bedroom units in a specific submarket [9]. Use the platform’s geo-targeted heat maps to pinpoint high-growth areas, and its booking conversion estimator to gauge whether new acquisitions align with your return-on-investment goals [8].
You can also track specific KPIs, such as lead time or length of stay, to identify trends in your target neighborhoods. This helps you time your market entry strategically, maximizing your chances of success [8].
3. Wheelhouse
Market Trends and Insights
Wheelhouse keeps a close eye on real-time booking activity in over 1,500 markets across more than 100 countries, covering both urban and vacation destinations [16]. It doesn’t just stop at the present - it provides occupancy projections for the next 12 months, helping you anticipate events and spot pricing opportunities well in advance [16].
By analyzing supply and demand patterns, the platform tracks inventory shifts in real time. This means you can identify areas facing supply shortages or surges, which can directly influence your strategy for expansion [16]. Additionally, it allows you to compare performance based on specific amenities like pools, porches, or patios [16]. With this level of detail, you’ll be better equipped to develop pricing strategies that align with market trends.
Pricing and Revenue Optimization
Once you have market insights, Wheelhouse helps you take action with its advanced pricing tools. Using a mix of data-driven, rule-based, and hybrid pricing methods, it adjusts rates based on real-time market signals [8]. You can further fine-tune your pricing with more than 15 customizable settings [8]. Tools like these have the potential to boost rental revenue by up to 20% [8].
The markets dashboard is particularly useful for operators managing multiple locations. It allows you to monitor unlimited markets simultaneously, making it easier to compare performance across properties [16]. You can segment properties by factors like performance level, listing type, stay duration, or unique features. This helps identify what’s working in one area so you can replicate that success elsewhere [16]. Bryant Loy, Director of Revenue Management & Marketing, shared his experience:
"There was one clear product and team that stood head and shoulders above any other we evaluated - Wheelhouse. The team helped us answer every question and made a complex & potentially lengthy onboarding process a breeze" [16].
These tools make managing multi-location operations far more efficient.
Best Use Case for Rental Expansion
Wheelhouse shines when it comes to evaluating new markets before making significant investments. With access to year-over-year historical data, you can see how neighborhoods perform during high-demand events, weekends, and seasonal shifts [16]. The Navigator tool adds another layer of insight by offering geospatial data and benchmarks to identify neighborhoods worth deeper exploration [8].
To make collaboration easier, you can export charts, graphs, and market data to share with team members, property owners, or investors when presenting your expansion plans [16]. Wheelhouse offers a free trial and demos upon request [16]. Pricing is straightforward: 1% of revenue per booking or a flat fee of $19.99 per listing per month [8].
How To Analyze a Short-Term Rental Property for Beginners 2024/2025 (Including Tools!)
4. PriceLabs
PriceLabs delivers a comprehensive suite of tools for market analysis, offering both big-picture trends and hyperlocal insights that are critical for growing rental portfolios.
Market Trends and Insights
With data from over 500,000 listings across 150+ countries, PriceLabs provides a global view of pricing trends. It leverages the World STR Index, offering historical data since 2021, updated monthly to enable year-over-year comparisons of key metrics like RevPAR and ADR [17].
For a more localized perspective, the Neighborhood Data tool allows you to examine performance within a radius as small as 1 kilometer (about 0.6 miles). This is especially useful in identifying high-performing areas in the U.S., whether it’s a bustling urban center or a seasonal coastal hotspot. Its 40+ filters let you benchmark micro-market performance with precision, helping you spot patterns like seasonal demand spikes [18][4].
This level of detail is invaluable for making informed, dynamic pricing decisions.
Pricing and Revenue Optimization
PriceLabs takes the guesswork out of pricing with automatic rate adjustments based on real-time demand, seasonal trends, local events, and market dynamics. The Minimum Stay Recommendation Engine simplifies stay restrictions by analyzing booking behaviors, a game-changer for managing properties across multiple locations, a key part of scaling rental growth.
The Portfolio Analytics dashboard provides a clear view of monthly revenue, occupancy rates, ADR, and RevPAR. Tools like scatter charts and the Booking Analyzer make it easy to identify underperforming listings at a glance, ensuring no opportunity for improvement is overlooked [17].
Integration Capabilities
PriceLabs integrates seamlessly with over 150 property management systems and channel managers, including Airbnb and Vrbo. This allows optimized pricing and restrictions to be synced across all platforms effortlessly. This is one of several ways to automate rental operations for better efficiency. The Report Builder consolidates data from calendars and reservations into customizable dashboards, letting you organize insights by city, bedroom count, or other custom categories. Automated updates ensure your performance metrics are always current [17].
Best Use Case for Rental Expansion
If you're considering expanding your rental portfolio, PriceLabs is an invaluable tool. Its Revenue Estimator Pro projects potential revenue for any address using Airbnb data within a 15 km (9.3-mile) radius, helping you gauge ROI and net operating income before making a purchase.
Market Dashboards are available starting at $9.99 per month, and PriceLabs offers a 30-day free trial. Additionally, several free tools, such as the World STR Index and Portfolio Analytics, make it easier to explore opportunities without upfront costs [17][18][4].
5. Mashvisor
Mashvisor provides a powerful, nationwide perspective on the U.S. housing market, leveraging advanced analytics to cover 95% of the market. This platform offers detailed insights to help investors make informed decisions about expansion opportunities [22].
Market Trends and Insights
Mashvisor’s Market Finder tool offers a broad view of investment opportunities across the country. Using the proprietary Mashmeter score, it evaluates neighborhood potential by combining historical data, current trends, and demographic factors like renter-to-homeowner ratios and population growth [2][6][1]. From state-level overviews to city-specific details, users can explore metrics with tools like the Real Estate Heatmap and Neighborhood Analytics. These features break down key data points, including price per square foot, historical rental income, median property prices, cash-on-cash returns, and occupancy rates [19][1][21]. For example, a price-to-rent ratio of 21 or higher often indicates strong rental demand since high property prices push many toward renting [19].
Pricing and Revenue Optimization
The platform’s Optimal Rental Strategy tool allows users to compare long-term and short-term rental performance, helping to identify the most profitable approach [20][23]. Meanwhile, the Investment Property Calculator estimates recurring costs like property taxes, insurance, and maintenance, while also calculating key metrics like cap rate and cash-on-cash return [1][6]. Experts suggest that city-level investments should target cap rates above 5%, while individual properties should ideally deliver returns exceeding 8% [1]. Mashvisor also provides up to 12 months of historical rental income data for active Airbnb listings, making it easier to predict seasonal revenue trends. Additionally, its 10-year investment payback table helps investors forecast when a property will turn fully profitable [23].
Geographic Coverage
Mashvisor offers extensive data coverage, including short-term rental regulations for over 500 cities and detailed neighborhood-level listings across U.S. markets [22][6]. By pulling billions of data points from sources like the MLS, Zillow, Rentometer, Airbnb, and the Census Bureau, the platform ensures up-to-date insights, with most figures refreshed daily [22].
Best Use Case for Rental Expansion
Mashvisor simplifies market research, cutting what could take months of manual analysis down to just 15 minutes with its automated tools [1][6]. Its regulatory rules feature is particularly useful, offering detailed information on short-term rental regulations - such as permit requirements and zoning restrictions - for over 500 cities [6][22].
"The Mashvisor platform helps you make faster and smarter real estate investment decisions. It eliminates the need for the tedious process of performing real estate market analysis and investment property analysis with spreadsheets and replaces them with a set of highly interactive real estate investing tools." – Seth Williams, Experienced Real Estate Investor and Mentor, REtipster [22]
Mashvisor’s pricing starts at $39.99 per month (billed annually) for the Lite plan. The Standard plan, priced at $74.99 per month, includes tools like Market Finder and Heatmap, while the Professional plan at $99.99 per month adds features such as multifamily filters and larger data exports [22]. These plans offer clear pricing options to support quick and efficient expansion planning, while Mashvisor’s detailed geographic insights pave the way for more focused market strategies in the future.
6. Rentana
Rentana is a revenue intelligence platform powered by AI, built specifically for multifamily property expansion. Traditional spreadsheets often lead to mistakes and outdated information, but Rentana automates data collection from MLS listings and property management systems, delivering real-time, actionable insights [7][3].
Market Trends and Insights
Using predictive analytics, Rentana forecasts rental demand, future rents, and occupancy rates by analyzing historical data alongside current market activity [7][3]. Users can explore insights from a portfolio-wide view down to individual units, enabling a detailed understanding of supply and demand trends [7]. The platform also provides neighborhood-level insights, such as population growth, safety scores, and local amenities, helping users identify areas with strong rental potential [7]. With its "transparent comps" feature, Rentana offers more than just numbers - it includes details on floor plans, amenities, fees, and even integrates Google Street View for added context [7].
Pricing and Revenue Optimization
Rentana's AI-driven pricing recommendations are designed with transparency in mind, clearly showing the data and logic behind each suggestion [7]. This approach builds trust and confidence among users. In a pilot program with 29th Street Capital, Rentana delivered impressive results: a $4.6 million valuation increase, a 3.5% boost in Net Rental Income, 21× faster onboarding, and 36× quicker support response times [3].
Integration Capabilities
Rentana seamlessly integrates with your existing systems, enhancing its pricing insights with real-time data connections. The platform syncs with MLS listings for live deal sourcing and connects with property management systems to centralize tenant, lease, and maintenance information [7]. It also supports flexible data access through downloads, APIs, and Business Intelligence (BI) integrations, ensuring your insights stay current across your tech stack [7]. By unifying these processes, Rentana eliminates the hassle of manually cross-referencing multiple sources. This is a key step in any rental business automation checklist for scaling operations.
Best Use Case for Rental Expansion
Rentana is ideal for organizations managing growing portfolios across various locations, asset types, or clients. Its grouping feature allows users to compare the performance of different geographic portfolios side-by-side, making it easier to pinpoint properties requiring immediate attention [7]. Metrics browsers and customizable reporting tools simplify the process of sharing location-specific performance data with regional teams, streamlining expansion planning [7].
"I would recommend Rentana without a doubt. The UI is miles ahead, we trust their data security, and their fast, insightful and personalized platform gives us a strategic advantage to grow our assets." – Robert Waz, VP at 29th Street Capital [3]
sbb-itb-eb44693
7. Zillow
Zillow stands out as a go-to resource for market analysis, offering tools and metrics that support informed decisions for rental expansion. With features like the Market Heat Index, Zillow provides valuable insights into market conditions across the 300 largest markets in the United States[24].
Market Trends and Insights
Zillow’s Market Heat Index scores markets on a scale of 1 to 100, factoring in user activity, price trends, and listing speeds. A score above 55 signals a seller’s market, while scores below 44 indicate a buyer’s market. For a quick snapshot, the Market One-Pager delivers economic data at various geographic levels - state, metro, and zip code - covering home values, active listings, and rental trends. Additionally, the Rental & New Construction Dynamics dashboard tracks construction permits and listings with concessions, helping predict inventory changes that could influence rental prices. Together, these tools provide actionable insights to refine your site selection strategy.
Geographic Coverage
Zillow’s data spans the entire U.S., offering detailed insights at national, state, metro, and even neighborhood levels. The Housing Market Snapshot uses the Zillow Home Value Index (ZHVI) to reflect typical home values, offering a more stable perspective than just active listings. Heat maps further enhance this by pinpointing opportunities at the neighborhood level, making it easier to identify promising areas for investment[24].
Best Use Case for Rental Expansion
Zillow is particularly beneficial for rental businesses in the early stages of research and site selection. Its free tools allow for quick market comparisons and provide exportable data - perfect for creating pitch decks or investment proposals. The Market One-Pager’s zip-code-level insights make it an excellent resource for businesses targeting multiple locations[24].
"Consumers value agents with local expertise." – Jordan Teicher, Zillow[24]
With its comprehensive data and user-friendly tools, Zillow adds another layer of clarity to rental expansion strategies, complementing insights from other platforms.
8. CoStar
While earlier tools focus on residential or vacation rental analytics, CoStar takes a different approach by catering to the commercial real estate sector, making it a go-to platform for businesses planning multi-location expansions.
CoStar provides a wealth of commercial real estate data, covering over 6 million properties and 11 million comparables. Its reach spans more than 3,000 markets and submarkets across the U.S., supported by a research team of over 1,600 professionals. This team employs fieldwork, aerial imaging, and drone technology to maintain the accuracy and reliability of the platform’s data[25][26].
Market Trends and Insights
CoStar excels in delivering detailed market insights, including vacancy forecasts, construction activity tracking, and rent trend analysis. Users can access interactive charts to create custom short- and medium-term forecasts tailored to different economic conditions. The platform also offers submarket analytics, allowing users to refine searches based on criteria like property size, age, rating, or clustering. To add context, CoStar includes commentary from its in-house analysts, available in both written reports and video updates[25][26].
Geographic Coverage
Focused primarily on the U.S., CoStar provides granular market and submarket insights, tracks demographic trends, and offers direct access to "true owner" listings. This enables users to connect directly with property owners rather than relying solely on brokers. For businesses eyeing global opportunities, CoStar’s Global Analytics extends its reach internationally, making it a valuable resource for companies exploring markets beyond U.S. borders[25].
Integration Capabilities
CoStar simplifies workflows by combining property data, analytics, and news into a single platform. Users can share saved searches, market alerts, and property details with team members or brokers, streamlining collaboration. The platform also sends automatic notifications for saved searches, alerting users to new properties or expiring leases - ideal for identifying off-market opportunities. Additionally, integrations like STR Benchmark bring together commercial real estate data and hospitality performance metrics, offering deeper insights for businesses evaluating potential locations[25].
Best Use Case for Rental Expansion
CoStar is particularly beneficial for rental businesses looking to expand into multiple commercial locations. A practical example of its impact comes from The Hertz Corporation. In January 2026, John Grotto, Senior Director of Real Estate at Hertz, highlighted how CoStar’s market data and lease analytics helped the company save $1,000 per month on a five-year lease. That’s a total of $60,000 saved on just one transaction - a clear demonstration of how CoStar can add value by identifying cost-saving opportunities and strategic locations.
"If I save $1000 a month on a 5-year lease, then I've saved the Hertz Corporation $60,000 for just one transaction. That's where we add value in the real estate department with CoStar." – John Grotto, Senior Director of Real Estate, The Hertz Corporation[25]
9. Lockii
Lockii isn’t your average market analysis tool. Instead of just focusing on data visualization, it combines operational ease with actionable insights. At its core, Lockii is a self-hire platform designed to simplify rental management. With features like 24/7 contactless pickup and return using digital locks (powered by IglooHome), it offers a seamless experience. Even better, it’s budget-friendly - just $12 per month per locked item - making it a low-risk way to explore new markets while cutting down on on-site staffing.
Integration Capabilities
Lockii’s integrations are designed to boost efficiency and accuracy, ensuring smooth operations across the board:
- Stripe: Handles secure payments, identity verification, and terminal services.
- Zapier: Syncs booking data with CRM tools, accounting systems, and more.
- Google Analytics, Meta Pixel, and Telematics Guru Tracking: Tracks customer engagement and asset usage with built-in GPS functionality.
Ideal for Rental Business Growth
With these integrations, Lockii is perfect for rental businesses looking to expand. Whether you’re renting out trailers, cars, equipment, bikes, or scooters, Lockii’s cloud-based, multi-location system makes scaling a breeze. It enables businesses to break into new markets quickly while collecting valuable data on booking patterns and asset performance. This insight helps companies understand market demand and allocate resources effectively as they grow.
10. Rentometer
Rentometer is a go-to tool for landlords and property managers looking for accurate, localized rent data. It provides detailed rent insights for properties across the United States, helping users evaluate current rent levels and trends in specific markets. Its Pro Reports combine rent estimates, historical data, and in-depth analysis, while the QuickView™ Rent Estimates offer a snapshot of average and median rents, making it easier to refine pricing strategies [27].
Geographic Coverage
Rentometer delivers rent data for properties nationwide, blending current estimates with historical trends and public records to provide reliable market insights. Long-time user Jon S. shares his experience:
"I've been using Rentometer for years to quickly get a rough market-rent estimate for any neighborhood I'm considering. Later in my due diligence, I'll look at actual comps -- and Rentometer is almost always right on the money."
This combination of accuracy and accessibility makes it a trusted resource for rental market analysis [27].
Integration Capabilities
The platform's API enables seamless integration of real-time rent data into various applications and workflows. For larger projects, the Batch Processor can analyze up to 500 properties at once, making it an efficient choice for evaluating extensive portfolios. Additionally, the Essential Plan includes QuickView estimates, Pro Reports, CSV downloads, and mobile app access, ensuring flexibility for users who need insights on the go [27].
Best Use Case for Rental Expansion
Rentometer is particularly effective for businesses expanding into new markets. Its data-driven insights support thorough due diligence and market research and location planning. Richard Z., who runs a property management company in the Tulsa metro area, highlights its value:
"We own a property management company in the Tulsa metro and have been using Rentometer for 3+ years... we often share the analysis report with our clients."
The platform also allows businesses to customize Pro Reports with their logo and contact details, adding a professional touch when presenting data to clients. This feature, combined with its ability to analyze multi-unit acquisitions, makes Rentometer a powerful tool for rental operators fine-tuning their pricing strategies and scaling their operations [27].
Tool Comparison Table
Choosing the right market analysis tools depends on your rental business type and growth goals. For individual landlords, straightforward rental income estimates and insights on local trends are key, making platforms like Zillow and Rentometer great options. Real estate investors, on the other hand, benefit from tools offering in-depth cash flow modeling and ROI forecasting, such as Mashvisor and Rentometer. If you're a professional property manager, you'll likely need portfolio-level benchmarking - Key Data is perfect for vacation rental managers, while Rentana is tailored for multifamily portfolios. For asset managers, Rentana’s AI-driven pricing insights help pinpoint underperforming assets [7].
To simplify your decision-making, this table highlights the core features and ideal use cases of each tool. While most tools focus on analyzing _where_ to expand, Lockii takes a different approach by addressing the _how_. It provides the operational backbone for contactless, staff-free rentals through features like digital lock integration and automated messaging [28]. This combination allows rental businesses to not only analyze new markets but also implement operations seamlessly using Lockii's self-service platform.
| Tool | Main Strength | Best Use Case | Geographic Reach | Key Integrations |
|---|---|---|---|---|
| AirDNA | Short-term rental data analytics | Vacation rental market research | Global | PMS platforms |
| Key Data Dashboard | Direct-source vacation rental data | Professional property management | Global/U.S. | 40+ PMS integrations |
| Wheelhouse | Dynamic pricing automation | Revenue optimization | U.S. Nationwide | Major booking platforms |
| PriceLabs | Automated pricing strategies | Short-term rental pricing | Global | Airbnb, Vrbo, Booking.com |
| Mashvisor | ROI heatmaps & STR vs. LTR comparison | Finding new investment locations | U.S. (Neighborhood level) | Property search tools |
| Rentana | AI-driven revenue intelligence | Multifamily portfolio management | U.S. (Multifamily) | API, BI, PMS |
| Zillow | Massive listing database | Quick rent comparables | U.S. | Trulia, HotPads |
| CoStar | Commercial real estate data | Large-scale market analysis | U.S. | Enterprise systems |
| Lockii | Contactless operations & self-service | Multi-location rental expansion | Global | IglooHome, Stripe, Zapier |
| Rentometer | Hyperlocal rent comps & API | Investors & agents | U.S. | API, Mobile app |
Lockii’s integration with Zapier streamlines operations by syncing booking data, triggering identity verification for new reservations, following a contactless rental security checklist, and linking GPS tracking to market decisions. This operational framework pairs seamlessly with market analysis tools, enabling businesses to quickly act on high-potential opportunities without needing local staff or traditional retail setups.
Conclusion
Choosing the right market analysis tools can transform your strategy by grounding decisions in solid data. Whether you're a landlord evaluating rent comparisons in a new area or an asset manager handling a vast portfolio, aligning the tool to your specific goals - be it short-term rentals, long-term leases, or commercial properties - can uncover profitable opportunities while steering clear of inefficient growth.
Access to accurate, real-time data from Property Management Systems is critical. Direct-source reservation data offers the precision needed to justify pricing decisions and maintain homeowner trust. On the other hand, scraped data from listing sites often lags behind by weeks and can misrepresent performance metrics[9]. For example, 29th Street Capital's success with Rentana highlights how dependable analytics can drive measurable results[3]. The U.S. short-term vacation rental market, valued at $68.64 billion in 2025, is forecasted to grow by 7.4% annually through 2030[9], emphasizing the importance of tools that can seize these opportunities.
While analysis tools guide where to expand, operational platforms like Lockii ensure seamless execution. With features like Zapier integration to sync booking data, automate identity verification, and enable GPS tracking for multi-location rentals, Lockii bridges the gap between strategy and action. This allows businesses to scale into new locations without the need for on-site staff or costly retail spaces.
To maximize results, focus on tools that address your primary needs - whether it's pricing optimization, portfolio benchmarking, or operational scalability - and integrate smoothly into your existing workflows, avoiding the creation of isolated data silos. As Robert Waz, VP at 29th Street Capital, shared:
"I would recommend Rentana without a doubt. The UI is miles ahead, we trust their data security, and their fast, insightful and personalized platform gives us a strategic advantage to grow our assets."[3]
When smart analysis joins forces with automated operations, scaling your business becomes less of a challenge and more of a consistent, repeatable strategy for growth.